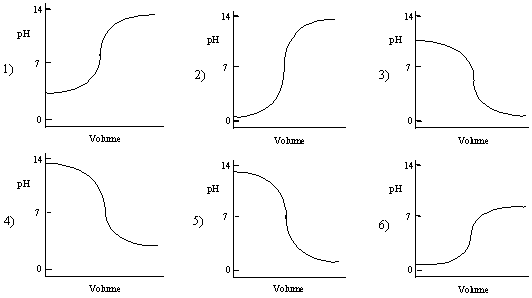
Which one of the following plots is the best representation of the titration curve which will be obtained in the titration of a 0.1
M weak base with a
strong acid of the same concentration? In all plots, the pH of the solution is plotted versus the volume of the strong acid added.